
Three Fair Value Gaps Are Stacked on Your Chart — Which One Do You Trade?
Introduction: Three Boxes, One Decision You Don't Know How to Make
A strong impulsive move leaves not one fair value gap behind but three, stacked almost on top of each other across a handful of consecutive candles. Now you're staring at three separate boxes, each a plausible entry, each with a slightly different price, and no clear rule for which one is "the" zone. Pick the shallowest and you might miss the fill entirely if price only reaches the edge of the cluster. Pick the deepest and you might be setting an entry price the move never actually needs to reach.
The instinct to treat this as three separate decisions is the source of the confusion. A cluster of fair value gaps formed by one continuous displaced move isn't three independent opportunities stacked coincidentally — it's the byproduct of one imbalance that happened to span multiple candles, and the correct read treats it as a single combined zone rather than three competing ones.
The confusion is understandable, because visually nothing distinguishes a genuine three-gap cluster from three unrelated gaps that happen to sit near each other by coincidence. Both look identical on the chart — three boxes, roughly stacked. The distinction that actually matters is mechanical, not visual: did these gaps form from one continuous run of displaced candles, or from separate, unrelated moves that simply ended up overlapping in price. Getting that distinction right is what determines whether combining them into one zone is the correct read or a mistake in the other direction.
This post covers what a fair value gap represents at the candle level, why strong moves tend to produce several stacked together rather than one clean gap, and the specific way a stacked cluster should be read and traded as a unified zone instead of three separate guesses.
The Core Logic: One Imbalance, Not Three
What an FVG Actually Represents
A fair value gap forms across a three-candle sequence when the high of the first candle and the low of the third candle don't overlap, leaving a price range in between that the market moved through without any trading actually occurring at those prices. That gap represents genuine imbalance — a range where buyers and sellers didn't transact, which the market has a tendency to eventually revisit and at least partially fill, because unaddressed imbalance tends to get addressed rather than permanently ignored.
Why Multiple FVGs Stack in the Same Direction
A single strong impulsive move rarely produces its displacement across exactly one candle. More often, a genuinely strong move continues its momentum across several consecutive candles, and each of those candles can independently satisfy the three-candle gap condition relative to its neighbors. The result is several overlapping or adjacent gaps stacked through the same price region — not because three separate imbalances occurred, but because one sustained imbalance happened to be distributed across a run of candles rather than concentrated in a single one.
This is actually informative rather than just a labeling nuisance: the presence of a stacked cluster, rather than a single clean gap, is itself a signal about the strength of the move that produced it. A move strong enough to leave three or four consecutive candles each satisfying the gap condition is a materially more forceful displacement than one that produces a single isolated gap and then consolidates. Reading cluster size as a rough proxy for move strength is a legitimate use of the pattern, separate from the question of how to trade the resulting combined zone.
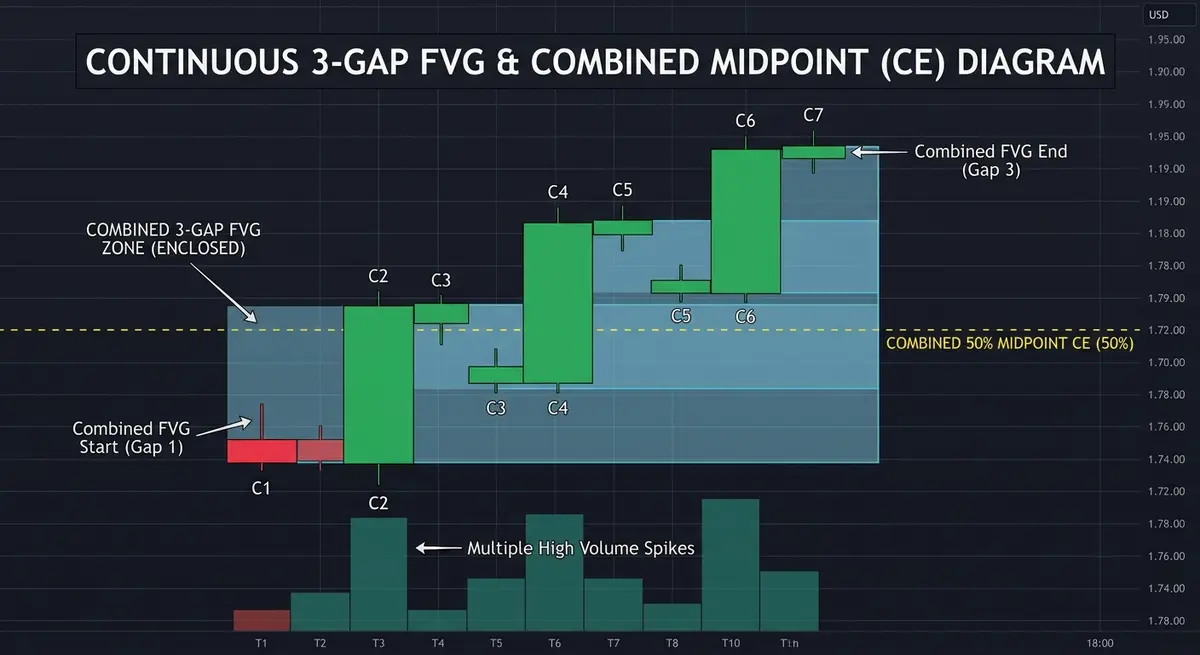
The Consequent Encroachment Confusion: One Combined Zone, Not Three
Consequent encroachment (CE) refers to the midpoint of a fair value gap — often treated as the more precise reaction point within the broader gap rather than the gap's outer edges. When gaps are stacked, the common mistake is calculating a separate CE for each of the three individual gaps and treating each as its own distinct level. The more accurate read treats the entire stacked cluster as one combined gap, spanning from the highest high to the lowest low across the whole sequence, with a single CE calculated from that combined range — because the underlying imbalance was one continuous event, not three separate ones that happen to share a wall.
Why Treating Stacked Gaps as Separate Opportunities Misreads Reaction Points
Trading each of the three stacked gaps as an independent entry produces a distorted picture of where price is actually likely to react. Price filling into the shallowest gap in the cluster doesn't necessarily mean anything structurally different than price filling slightly deeper into the second one — both are still within the same combined imbalance, and reading them as three separate tests inflates the apparent number of reaction opportunities the setup actually offers. A trader who treats the shallow edge as one trade and the deep edge as a separate second trade, with a full stop-out in between, has effectively doubled their risk on what was mechanically a single zone.
There's also a subtler cost to this mistake beyond doubled risk: it produces a misleading track record. A trader logging "FVG reaction" as a distinct, repeatable setup that fired three times on one chart, when it was actually one imbalance tested three times at slightly different depths, ends up with an inflated sample size and a false sense of how often the pattern genuinely occurs. The apparent frequency of the setup is an artifact of miscounting, not evidence the pattern is more common than it actually is.
Why Partial Mitigation Changes the Read
Once price fills into part of a combined gap without reaching the full depth, the remaining unfilled portion is what should define the live zone going forward — not the original full-depth boundaries. A cluster that's been half-filled on a prior touch has already addressed some of its imbalance; treating it as if the entire original range were still fully live overstates how much unaddressed imbalance is actually left to react against on a subsequent test.
The Bridge: How FVG Indicator Solves This
Manually recalculating a combined boundary across three overlapping gaps, tracking a single CE for that combined range, and then adjusting the live boundary again after a partial fill is a multi-step recalculation most traders skip, defaulting instead to eyeballing whichever individual gap looks most reactive in the moment.
FVG Indicator is built to treat a stacked cluster as one object rather than requiring that recalculation by hand:
- Automatic gap combination — adjacent or overlapping gaps formed by the same continuous move are merged into a single zone rather than displayed as separate, competing boxes.
- Combined CE calculation — the consequent encroachment level is calculated from the full combined range, giving one precise reaction point for the cluster instead of three conflicting midpoints.
- Partial mitigation tracking — the live boundary of the zone updates automatically once part of it has been filled, so the remaining unfilled portion — not the original full range — is what's presented as still active.
- Fill-percentage display — showing how much of the combined zone has already been addressed by prior price action, so the remaining unmitigated portion is explicit rather than something to estimate visually.
Reading how a combined zone behaves on its first touch connects directly to why price keeps filling the fair value gap and reversing, which covers the reaction mechanism itself. And because a combined gap doesn't always simply fill and reverse — sometimes the market fills it fully and continues through, changing its function entirely — that related behavior is covered in inversion fair value gaps explained.
Execution: How to Read the Indicator on Your Chart
- Trade the combined zone boundary, not the individual stacked gaps within it. If the indicator has merged a cluster into one zone, treat that merged boundary as the level to react to rather than picking one of the original sub-gaps.
- Check the fill-percentage before assuming a zone is fully live. A cluster that's already been partially mitigated has less unaddressed imbalance remaining than a fresh, untouched one, even if it looks visually similar.
- Use the combined CE as your primary reaction reference, not a single sub-gap's midpoint. The combined CE reflects the full imbalance across the cluster and is the more reliable precision level for entries.
Frequently Asked Questions
Should I always combine stacked fair value gaps into one zone? When the gaps formed from one continuous displaced move across consecutive candles, yes — they represent a single underlying imbalance rather than three separate ones. Gaps that formed from genuinely separate, non-consecutive moves shouldn't automatically be combined just because they happen to overlap in price.
Which part of a combined gap is the most reliable place to enter? The consequent encroachment (CE) of the combined range is generally treated as the more precise reaction reference, though the outer boundary of the zone is also commonly used for a slightly earlier, more conservative entry. Which one fits depends on the rest of your confluence and risk tolerance for that specific setup.
What happens if price only fills part of the combined gap and then reverses? That's a partial mitigation — the filled portion has addressed some of the imbalance, and the remaining unfilled portion becomes the live zone going forward. A subsequent test should be read against that reduced remaining zone, not the original full-depth boundaries.
Ready to Trade the Zone, Not the Individual Gaps?
Three stacked boxes on your chart usually represent one imbalance wearing three outfits — trade the combined zone, and the guessing about which of the three matters disappears.
Ready to implement this institutional logic? Deploy the FVG Indicator on your charts now.