
Why Price Keeps 'Filling the Gap' and Reversing on You
Introduction: The Void That Isn't Empty
Price rips through a level, leaving a visible gap on the chart where almost no trading occurred. Hours or days later, price returns to that exact gap — and reverses, almost as if the level had gravity. Traders who don't understand why call it luck, or coincidence, or "the market being random." It's neither. That gap represents unfinished pricing business, and the market has a structural reason to revisit it.
This is the Fair Value Gap, and understanding why it gets filled — and why price so often reverses once it does — separates traders who can use it as a genuine entry tool from traders who treat it as a chart pattern to memorize.
The Core Logic: What a Fair Value Gap Actually Represents
The Three-Candle Definition
A Fair Value Gap forms across three consecutive candles. In a bullish FVG, the high of the first candle and the low of the third candle don't overlap — there's a visible price void between them, created by the second candle's aggressive, uninterrupted move upward. In a bearish FVG, the inverse: the low of the first candle sits above the high of the third, with the second candle driving price down through the space with no opposing pressure.
The critical detail is why the gap forms. It isn't a technical quirk of candlestick math — it's evidence that the move happened too fast for the opposite side of the market to provide adequate liquidity. Buyers or sellers weren't just outnumbered; they were effectively absent at those price levels during the move.
Why the Market Returns to Fill It
Markets price inefficiently in the short term and correct toward efficiency over time. A Fair Value Gap is, by definition, an inefficient stretch of price — a zone where trading barely occurred. This creates two separate forces pulling price back toward it:
- Unfilled resting orders. Participants who wanted to transact at those levels during the initial move often couldn't, because the price moved through too quickly. Their orders remain resting at those levels, waiting.
- Algorithmic fair-value referencing. A range with almost no completed trading doesn't represent an accepted, agreed-upon price. Institutional execution algorithms tracking volume-weighted fair value treat these zones as reference points the market is statistically likely to revisit before continuing.
This is the mechanical basis for "rebalancing" — the market isn't reversing out of some abstract sense of fairness, it's responding to real unfilled orders and algorithmic reference behavior that both point back toward the same price zone.
Why It Doesn't Always Fill Completely — And Why That Matters
This is the detail most retail explanations skip. Price frequently reacts before fully filling the gap, often at its midpoint — a level referred to as the Consequent Encroachment (CE). The CE represents the 50% mark of the gap, and it's a high-probability reaction zone in its own right, not just a waypoint on the way to a full fill.
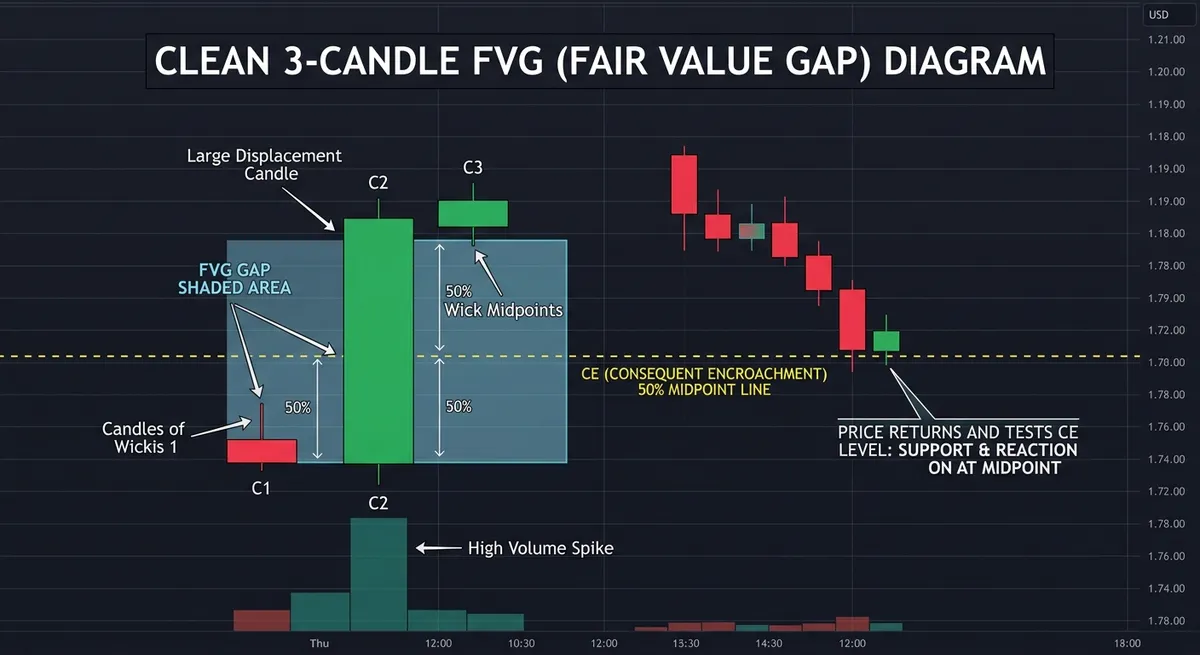
Waiting for a full fill assumes every gap behaves identically, which they don't. A gap formed with strong displacement and no accompanying order block nearby often gets fully filled. A gap formed alongside a fresh order block — where the two zones overlap — frequently reacts at the CE or even before it, because the combined zone represents a denser concentration of unfilled interest than the FVG alone.
Fresh vs. Mitigated Gaps
A Fair Value Gap that price has not yet returned to is "fresh" — the unfilled orders behind it are, in principle, still fully resting. A gap that price has already touched once and reacted to is "mitigated" — some or all of the original imbalance has already been addressed, and a second reaction at the same zone carries meaningfully less weight than the first. What happens when a gap fails outright instead of holding is a distinct setup in its own right, covered in inversion fair value gaps explained.
The Bridge: How FVG Detects and Grades This For You
Manually tracking every Fair Value Gap across a watchlist — noting whether each is fresh or mitigated, where its CE sits, and whether it overlaps with a nearby order block — is a high volume of bookkeeping to sustain by eye, particularly across multiple timeframes.
Why this specific concept benefits from automation: the FVG's core value depends entirely on its current status — fresh or mitigated, overlapping with an order block or standalone — none of which is visible from the raw candle pattern alone without tracking what's happened since it formed. A tool that only draws the box at formation, without tracking what happens afterward, misses the half of the concept that actually determines whether it's still tradeable.
The FVG tool addresses this directly:
- Automatic three-candle detection — plots bullish and bearish gaps the moment they form, across every timeframe you're watching.
- Fresh vs. mitigated tracking — updates each gap's status as price interacts with it, so a chart full of old, already-reacted zones doesn't get confused with genuinely untested ones.
- CE marking — highlights the 50% midpoint of every gap, giving you the higher-probability reaction zone rather than only the full boundary.
- Order block confluence flagging — surfaces when a gap overlaps with a marked order block, since that combined zone carries more weight than either concept alone.
Execution: How to Read the Indicator on Your Chart
- Check freshness before treating a gap as a live zone. A gap the tool marks as already mitigated should be weighted lower than one still marked fresh — a second reaction at the same level is a lower-probability trade than the first.
- Watch the CE line as your primary reaction zone, not just the gap's outer boundary. Price reacting and reversing at the CE is a normal, expected outcome — don't assume a trade has failed just because the gap wasn't filled completely.
- Prioritize gaps flagged as overlapping with an order block. When the FVG tool shows confluence with a marked order block, treat that zone as higher-probability than a standalone gap with no structural support behind it.
Frequently Asked Questions
Why does price always seem to come back and fill the fair value gap?
Because the gap represents genuinely unfilled orders left behind by a fast, one-sided move, along with a reference point institutional algorithms track as an area of incomplete price discovery. The return isn't random — it's the market addressing unfinished business at that level.
Should I wait for the gap to fill completely before trading it?
Not necessarily. Many reactions occur at the Consequent Encroachment — the 50% midpoint — rather than at the full boundary of the gap, especially when the gap overlaps with a nearby order block. Waiting for a full fill on every setup means missing a large share of valid reactions.
What's the difference between a Fair Value Gap and a general price imbalance?
Every Fair Value Gap is a type of imbalance, but not every imbalance is a Fair Value Gap. An FVG has a specific structure — a three-candle pattern where the outer wicks don't overlap — while "imbalance" is a broader term that can describe other forms of price inefficiency without that exact structural requirement.
Ready to Stop Guessing Where Price Will React?
A Fair Value Gap without tracking its fresh/mitigated status and its overlap with structure is just a box on a chart. The value is in what's happened to it since it formed.
Ready to implement this institutional logic? Deploy the FVG Indicator on your charts now.