
Best Time of Day to Trade Crypto for Maximum Volume (With a Volume Map)
Introduction: The Market Never Closes. Participation Still Does.
Crypto trades continuously, which leads many traders to assume that unlike forex or equities, there's no meaningful concept of a "session" — every hour is functionally the same. This assumption costs money in a specific, repeatable way: a structural signal formed during a genuinely low-participation window doesn't carry the same weight as an identical-looking signal formed while real volume is present, even though a 24/7 chart shows no obvious boundary between the two.
The absence of an official market close doesn't mean the absence of session structure. Participation in crypto still clusters around when the world's larger trading desks — many of which also trade traditional markets — are actively active, and the gaps between those windows behave meaningfully differently from the windows themselves. This post explains why sessions still matter in a market with no fixed hours, why clock time alone is the wrong variable to anchor to, and what to actually check instead.
The Core Logic: Why Crypto Still Has Sessions Without Having Hours
Sessions Exist Because Participants Do, Not Because Exchanges Require Them
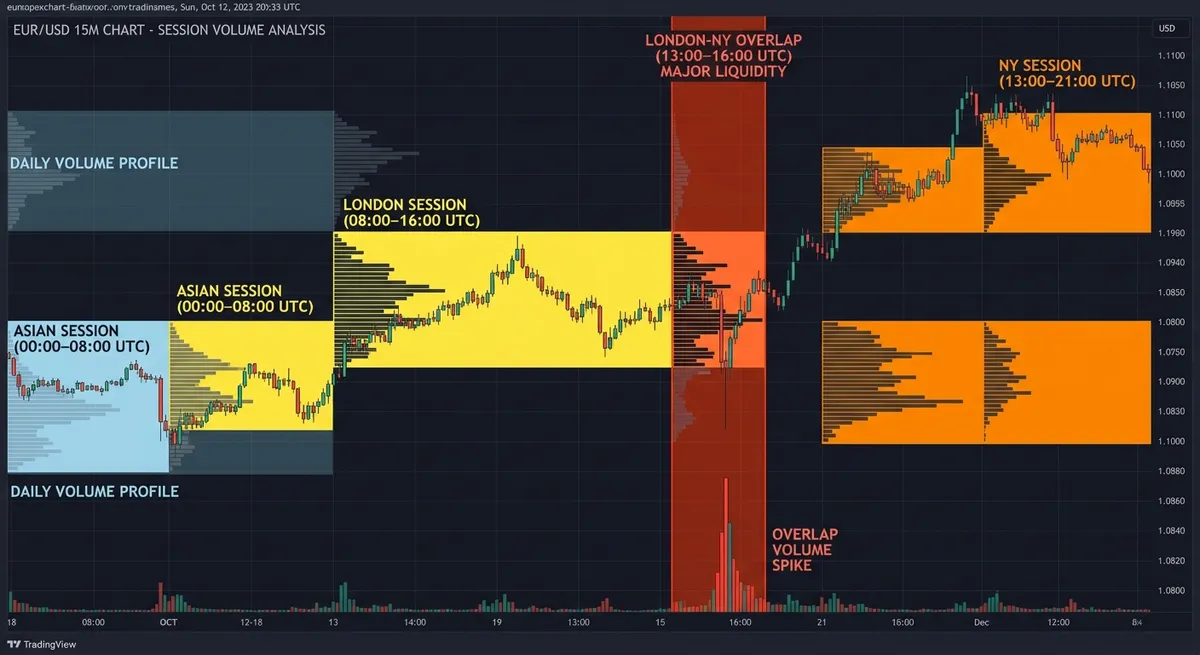
Crypto exchanges never close, but the people and desks trading on them aren't uniformly active around the clock. Participation clusters around recognizable windows that mirror traditional market sessions — a period of activity as Asian markets are active, a pickup as London opens, and typically the highest concentration of volume during the London/New York overlap, when both regions' active trading hours coincide. This clustering exists because a meaningful share of crypto's larger participants are also active in or influenced by conditions in traditional markets, not because any crypto exchange enforces trading hours.
Volume Is the Actual Variable — Clock Time Is Just a Proxy
The mistake in relying on a static "best hours to trade crypto" chart is treating clock time as the thing that matters, when it's only a rough proxy for the thing that actually matters: real participation. Two occurrences of the same hour on different days can carry meaningfully different volume depending on concurrent conditions — a public holiday in a major trading region, a significant macro data release, or simply a quieter weekend period. A fixed schedule built from historical averages will miss all of this, presenting a generic pattern instead of what's actually happening in the current session.
What Low-Volume Windows Do to Structural Reliability
During genuinely low-participation windows — commonly the late Asian session before London activity picks up — price can still produce moves that look identical to genuine structural shifts: breaks of recent highs or lows, apparent changes of character, seemingly decisive candles. The difference is that these moves are more easily produced by comparatively small orders relative to the thin available liquidity, which means they're statistically less likely to reflect the kind of broad, sustained conviction that structure concepts were designed to capture. This is conceptually related to the low-timeframe noise problem covered in why scalping crypto is so hard on the 1-minute chart — there, the issue was too small a sample per candle; here, it's too little participation across the board, regardless of timeframe.
Why Session Transitions Are Disproportionately Prone to Liquidity Sweeps
Session opens bring a fresh wave of participants and orders into the market simultaneously, and that new liquidity frequently references similar levels — recent highs and lows, and round numbers, which cluster stop-losses as covered in why your stop loss gets hit right before reversal. The combination of concentrated resting liquidity and a sudden influx of fresh participation at a session open makes these transition windows disproportionately likely moments for exactly the kind of liquidity sweep that post describes — not a coincidence, but a direct consequence of how session boundaries interact with where stops tend to sit.
Why a Generic Schedule Isn't Sufficient
Even a well-researched, historically accurate "best hours" chart is describing an average, not the current session. Reliable timing requires checking actual current volume and participation against what's typical for that window — not clock time alone — since conditions like holidays, weekend liquidity thinning, or a concurrent major macro event can make an ordinarily high-volume hour behave like a low-volume one, and vice versa.
The Bridge: How Session Volume Profile Replaces the Static Schedule With Real Data
A static "best hours" chart is a reasonable starting heuristic, but it can't account for what's actually happening in the current session — and checking real-time volume against historical norms manually, across multiple sessions, isn't something most traders track consistently while also managing everything else in a live session.
Why this specific problem benefits from a data-driven tool rather than a fixed schedule: the entire premise of session timing is that participation varies — a static chart built from historical averages is, by definition, unable to capture today's actual deviation from that average, which is precisely the information that matters most on any given day.
Session Volume Profile addresses this by:
- Real-time volume distribution mapping — shows actual current traded volume by price level and by session, rather than relying on a generic historical hours chart.
- Point of Control (POC) and Value Area tracking — highlights where volume has genuinely concentrated recently, giving a data-grounded reference for participation quality rather than an assumption based on clock time.
- Session-relative volume comparison — flags when current volume is running above or below what's typical for that specific session window, surfacing anomalies like holiday-thinned liquidity or unusually high activity outside normal peak hours.
- Session-transition visibility — marks the boundaries between sessions directly on the volume profile, making it easier to recognize the elevated liquidity-sweep risk that these transition windows carry.
Execution: How to Read the Indicator on Your Chart
- Check current session volume against the typical baseline before trusting a structural signal. A break of structure occurring during a session flagged as running below typical volume deserves more scrutiny than the same pattern during a session showing normal or elevated participation.
- Treat session-transition windows as elevated liquidity-sweep risk, not just a scheduling detail. A sharp move immediately around a marked session boundary is more likely to reflect the liquidity dynamics described above than pure directional conviction — wait for the transition to settle before reacting.
- Use the Point of Control and Value Area, not just the clock, to judge whether a level is significant. A price level with genuine volume concentration behind it carries more weight than one that simply happens to align with a "typically active" hour on a generic schedule.
Frequently Asked Questions
What is the best time of day to trade crypto for volume?
The London/New York session overlap typically carries the highest concentration of volume, since it's when both regions' most active trading hours coincide. However, actual volume on any given day can deviate from this general pattern due to holidays, macro events, or unusual weekend conditions, which is why checking real-time volume is more reliable than relying on a fixed schedule alone.
Does crypto actually have trading sessions like forex, given that it trades 24/7?
Yes, in terms of participation even though there are no official operating hours. Volume clusters around the same general windows as traditional markets — Asian, London, and New York sessions — because many of crypto's larger participants are also active in or influenced by those traditional market hours.
Why does price behave differently during low-volume hours?
During low-participation windows, comparatively small orders can move price more than they would during higher-volume periods, which can produce moves that visually resemble genuine structural shifts without reflecting the same broad, sustained conviction. This makes structural signals formed during these windows statistically less reliable than identical-looking signals formed during higher-volume conditions.
Ready to Trade the Session You're Actually In, Not the Average One?
A generic "best hours" chart tells you what usually happens. A volume profile tells you what's happening right now — and those are frequently not the same thing.
Ready to implement this institutional logic? Deploy the Session Volume Profile on your charts now.