
Why Scalping Crypto Feels Impossible on the 1-Minute Chart (And the Fix)
Introduction: More Practice Isn't Fixing This
You drop to the 1-minute chart to scalp, and every setup that would look decisive on a higher timeframe instead looks like it's lying to you. A break of structure reverses within three candles. An order block that would hold on the 4-hour chart gets run through immediately. You assume you need more screen time, sharper reflexes, faster execution. After months of practice, the same pattern continues, because the problem was never reaction speed.
The structural concepts that work reliably on higher timeframes don't simply get "harder" on the 1-minute chart — a meaningful share of them stop measuring what they were designed to measure. This post explains exactly why that happens, why it's an information problem rather than a skill problem, and what actually needs to change for structure-based scalping to work at this resolution.
The Core Logic: Why Structure Concepts Degrade at High Frequency
Every Candle Represents a Smaller, Noisier Sample
A break of structure or a change of character is, at its core, a statement about the balance of aggressive buying and selling pressure over the period a candle represents. On a 4-hour chart, that balance reflects a substantial amount of accumulated order flow — enough that a genuine shift usually reflects real, sustained conviction. On a 1-minute chart, the same pattern can be produced by a single moderately-sized market order, a temporary bid/ask imbalance that resolves within seconds, or cross-exchange arbitrage activity reacting to a fleeting price discrepancy between venues. The pattern looks identical. The underlying cause is not.
The Concepts Were Built for a Different Scale of Participation
BOS, CHoCH, and order blocks were derived from observing how larger, more deliberate positioning shows up in price action — the kind of positioning that takes real size and, correspondingly, real time to execute without moving the market excessively against itself. At 1-minute resolution, a large share of what technically qualifies as a structural break carries none of that underlying deliberateness. It's not that the definitions are wrong — a break of structure is still a break of structure by the letter of the definition — it's that the definition was never calibrated to distinguish genuine institutional-scale conviction from routine short-term noise at this frequency.
Crypto Futures Adds a Noise Source That Doesn't Exist Elsewhere
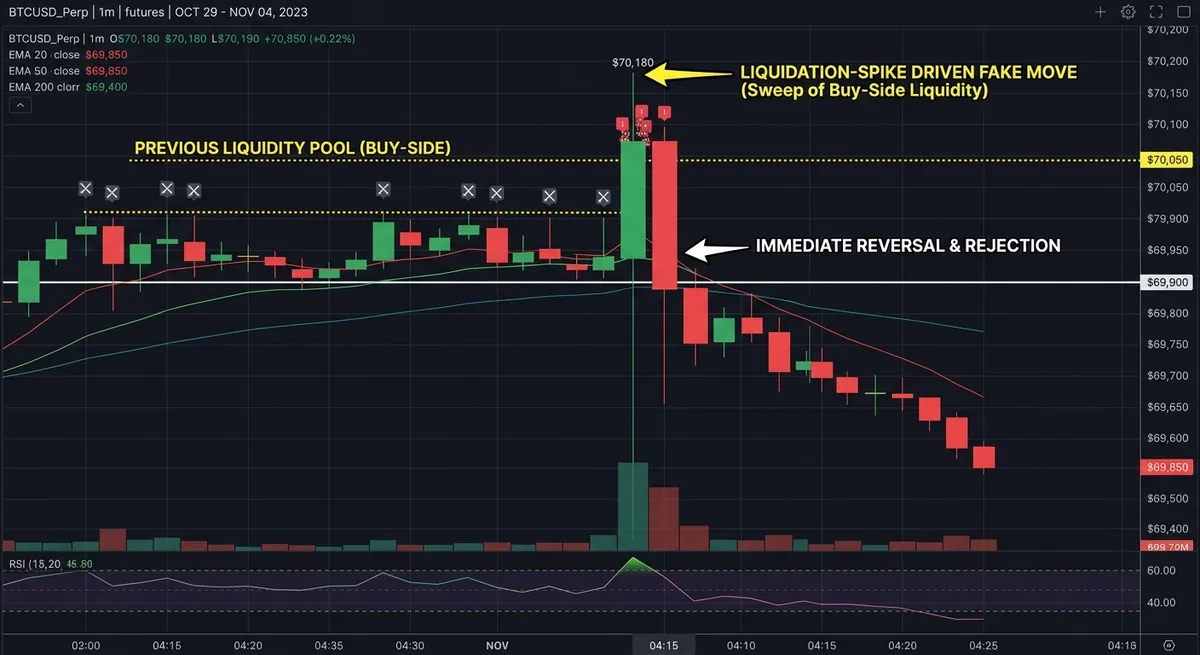
Beyond ordinary order flow noise, crypto futures scalping specifically deals with liquidation-driven spikes — sharp, fast price movements caused by cascading forced exits rather than directional conviction, covered in more depth in the best indicator for catching stop hunts on crypto futures. On a 1-minute chart, a liquidation cascade produces a candle that is visually indistinguishable from genuine displacement: fast, one-directional, often with an accompanying imbalance. The difference is that a liquidation spike represents forced, mechanical selling or buying rather than a deliberate directional bet, and it frequently reverses as sharply as it appeared once the cascade exhausts itself — leaving a 1-minute chart scalper who reacted to it holding a position against a move that was never going to continue.
Why Retail Scalpers Misdiagnose This as a Skill Problem
The natural conclusion, after repeated failed reactions to 1-minute structure, is that more screen time and faster pattern recognition will fix it. This diagnosis is incorrect for a specific reason: if a meaningful share of the patterns you're reacting to are statistically indistinguishable from noise using the information available on the 1-minute chart alone, no amount of practice recognizing that pattern faster addresses the underlying issue. You'd simply be getting faster at reacting to signals that don't reliably mean what they appear to mean. The problem is informational — the 1-minute chart alone doesn't contain enough context to tell genuine conviction apart from noise — not a matter of reaction time or chart-reading experience.
What Actually Distinguishes Genuine Signal From Noise at This Resolution
Reliable low-timeframe scalping requires checking conditions the 1-minute chart alone doesn't provide: whether the move aligns with or contradicts higher-timeframe structure (a 1-minute BOS in the direction of the 4-hour trend carries more weight than one against it), whether the displacement shows genuine speed and size consistent with real conviction rather than a single order or a liquidation-driven spike, and whether volume confirms the move rather than showing the thin, brief profile typical of a forced-liquidation cascade. No single one of these checks is sufficient alone — a move can align with higher-timeframe bias and still be a liquidation spike, or show genuine displacement and still run against a dominant trend. It's the combination that separates a scalpable signal from 1-minute noise.
The Bridge: How the High-Frequency Scalper Filters This Before You React
Manually checking higher-timeframe alignment, displacement quality, and volume confirmation for every candidate signal on a 1-minute chart isn't realistic to do at the speed scalping requires — by the time you've manually cross-referenced all three, the entry window the signal represented has often already closed.
Why this specific problem benefits from a rules-based filter rather than faster manual reading: the issue isn't reaction speed, it's that the 1-minute chart alone doesn't contain the context needed to classify a signal correctly, and gathering that context from other timeframes and data sources faster than a human can is exactly the kind of task automation is suited for — not because it reads the 1-minute candle better, but because it synthesizes the surrounding context the candle is missing, instantly.
The High-Frequency Scalper applies this filtering directly:
- Higher-timeframe alignment checking — cross-references every 1-minute structural signal against higher-timeframe bias in real time, rather than presenting all signals as equal-weight regardless of broader context.
- Displacement quality scoring — evaluates the speed and size of the move producing a signal, filtering out patterns generated by a single order or brief imbalance rather than sustained pressure.
- Liquidation-spike detection — flags rapid, one-directional moves consistent with forced-liquidation cascades separately from genuine displacement, addressing the specific noise source crypto futures scalpers face that isn't present in the same way on other markets.
- Volume confirmation overlay — checks whether participation actually supports the apparent structural shift, rather than treating price movement alone as sufficient evidence.
Execution: How to Read the Indicator on Your Chart
- Check the higher-timeframe alignment flag before reacting to any 1-minute structural signal. A break of structure flagged as aligned with the higher-timeframe trend deserves more weight than an identical-looking pattern flagged as against it.
- Confirm the displacement quality score before treating a move as genuine conviction. A signal scored low on displacement quality is more likely to reflect a single order or brief imbalance than sustained directional pressure, regardless of how sharp the candle looks.
- Treat a liquidation-spike flag as a reason to wait, not to chase. A rapid move tagged as liquidation-driven is more likely to reverse once the cascade exhausts than to continue as genuine displacement — let the flag clear before treating the move as a real setup.
Frequently Asked Questions
Why is scalping crypto so much harder on the 1-minute chart than on higher timeframes?
Because each 1-minute candle reflects a much smaller sample of order flow, which means patterns that would reliably indicate institutional-scale conviction on a higher timeframe can be produced on the 1-minute chart by a single order, a brief imbalance, or — specifically in crypto futures — a liquidation cascade. The pattern looks the same; the underlying cause frequently isn't comparable.
Can Smart Money Concepts like BOS and order blocks even be used on a 1-minute chart?
They can, but only reliably when cross-referenced against higher-timeframe context and displacement quality, since the definitions alone don't distinguish genuine conviction from short-term noise at this resolution. Using 1-minute structure signals in isolation, without that cross-reference, is where most of the unreliability comes from.
How do I filter out noise when scalping crypto on low timeframes?
Check whether a candidate signal aligns with higher-timeframe bias, whether the displacement behind it shows genuine speed and size rather than a single order's worth of movement, and whether volume actually confirms the move rather than showing the thin profile typical of a liquidation-driven spike. All three together provide meaningfully more reliable filtering than reacting to 1-minute structure alone.
Ready to Stop Reacting to Noise That Looks Like Signal?
The 1-minute chart was never going to get easier with more screen time, because the missing piece was never reaction speed — it was context the chart alone doesn't contain.
Ready to implement this institutional logic? Deploy the High-Frequency Scalper on your charts now.