
How to Set Up Volume Profile on Crypto When There's No Trading Session
Introduction: Your Profile Is Anchored to a Session That Doesn't Exist
You add a volume profile to a crypto chart, and the point of control (POC) and value area lines look reasonable at a glance — until you notice the session resets at a timestamp that means nothing for this market. Sometimes the reset lands in the middle of the most active hours of the day. Sometimes yesterday's "session" profile spans a period that includes two completely different volume regimes stitched together as if they were one.
That's not a broken indicator. It's a correctly functioning tool anchored to the wrong clock. Volume profile as a concept comes from equity and futures markets, where a session has a hard open and close — 9:30 to 16:00, defined by an exchange bell. Crypto has no bell. It trades continuously, and if your profile is still using a session boundary built for a market that closes, every POC and value area it draws is describing a period that isn't actually a coherent trading session at all.
The reason this is easy to miss is that the profile still renders. Nothing throws an error, nothing looks obviously broken — you get a POC, a value area high, a value area low, all plotted with the same visual confidence as a correctly anchored profile would produce. The chart gives no indication that the boundary underneath those numbers doesn't correspond to anything the market itself recognizes as a unit.
This post covers what a volume profile session boundary is actually supposed to represent, why the default settings quietly break that representation on a 24/7 market, and the specific anchor settings that fix it so the POC and value area you're reading reflect a period that means something.
The Core Logic: What a Session Boundary Is Supposed to Represent
What a Volume Profile Session Actually Anchors To
A session volume profile isn't just "volume over the last N candles" — it's volume distributed across price for a specific, bounded period, chosen because that period represents a coherent unit of market behavior. On equities, that unit is the regular trading session, because volume, participation, and price behavior genuinely differ between the open, the regular session, and after-hours. The session boundary isn't arbitrary; it's chosen because it separates periods that behave differently.
Why the Default Boundary Breaks on a Market That Never Closes
Crypto has no open bell, no close, and no after-hours distinction in the same sense — but it does have real, recurring volume rhythm tied to when different regions are active. A default session setting inherited from equities markets draws a boundary at a time that has no relationship to crypto's actual volume rhythm, which means the "session" being profiled is just an arbitrary 24-hour slice, not a period chosen because it represents one coherent behavioral unit. The profile it produces is real data placed inside a session boundary that doesn't correspond to anything the market itself recognizes.
The practical consequence shows up most clearly right at the reset boundary. If the session resets at a moment that falls in the middle of a region's active trading hours, every session gets artificially cut in half — the first part of a genuine volume push gets counted in one session's profile, the continuation of that same push gets counted in the next, and neither profile ends up representing the full move. The POC calculated from either half will reflect a partial, truncated version of whatever the market actually did.
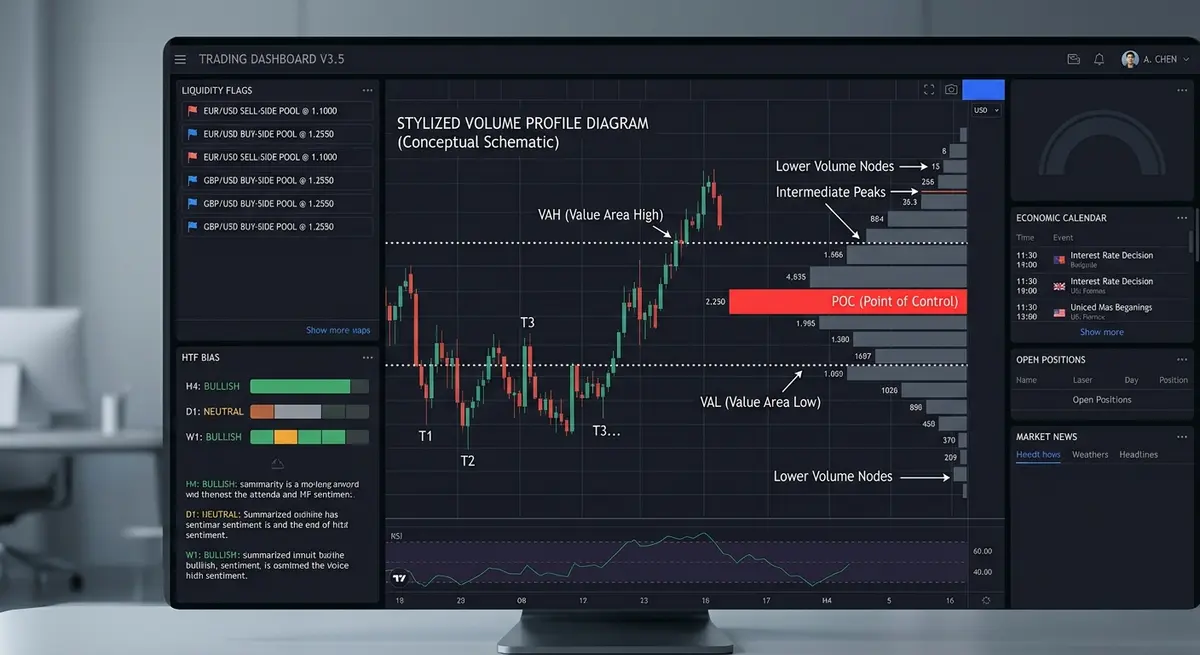
POC, VAH, and VAL: What They Mean When the Session Is Arbitrary
The point of control (POC) marks the price with the highest traded volume within the profiled range; the value area high and low (VAH/VAL) mark the boundaries containing roughly seventy percent of that volume. These are powerful reference levels — but only to the extent that the range they're calculated over is a meaningful unit. A POC calculated over a session boundary that arbitrarily splits one continuous volume regime into two pieces, or merges two different regimes into one, produces a POC and value area that don't correspond to any actual equilibrium the market found. The math is still correct; the input range is the problem.
The Misconception That More Data Means a More Accurate Profile
A common assumption is that a longer lookback — a weekly or monthly profile instead of a daily one — automatically produces a more reliable POC because it's built on more volume. More data isn't the same as more relevant data. A long lookback profile smooths over the fact that crypto's volume rhythm shifts within each 24-hour cycle; it will produce a stable-looking POC that's actually an average across several genuinely different behavioral periods, which is a different kind of misrepresentation than a badly-placed daily boundary, but a misrepresentation nonetheless.
The equity-market parallel is instructive here: nobody profiles a stock's volume across an entire week and treats the resulting POC as more meaningful than the individual session POCs that make it up, because the whole point of a session boundary is to isolate a coherent unit rather than blend several together. Crypto traders who reach for a longer lookback specifically to get a "smoother" or "more stable" POC are often solving a symptom of the wrong problem — the instability they're trying to smooth away is usually the result of a badly anchored daily session in the first place, not a genuine reason to blend multiple sessions together.
Why a Single Session's Profile Isn't a Complete Read on Its Own
Even a correctly anchored session profile is one input, not a complete market read. A POC that held as support today can be irrelevant tomorrow if volume regime shifts meaningfully, and a value area from a single low-volume period carries less weight than one built from a session with typical or elevated participation. Reading one session's profile in isolation, without checking it against the prior session's levels or the broader volume trend, treats a single data point as if it were a standing structural level.
The more reliable read comes from comparing sessions against each other rather than trusting any single one in a vacuum. A POC that recurs at approximately the same price across three or four consecutive sessions is describing something the market keeps returning to — a genuine, repeatedly-defended equilibrium. A POC that appears once and never shows up again in subsequent sessions is more likely describing a transient imbalance specific to that session's conditions, not a level worth building a thesis around days later.
The Bridge: How Session Volume Profile Solves This
Manually recalculating a profile with a custom anchor on every chart, for every pair, across however many timeframes you trade, is a setup task most traders do once, get slightly wrong, and never revisit — which is exactly how a mis-anchored default setting quietly persists for months without anyone noticing the POC has never meant what it appeared to mean.
Session Volume Profile is built to let the session boundary itself be defined correctly for a continuous market rather than inherited from an equities default:
- Custom UTC-based daily reset — rather than an equities session clock, the profile anchors to a fixed daily UTC boundary, so every session represents a genuinely comparable 24-hour unit across every pair.
- Configurable rolling and fixed-range modes — supporting both a rolling recent-volume view and a fixed session-by-session breakdown, so you can choose the anchor style that matches whether you're reading current equilibrium or historical structure.
- Automatic VAH/VAL recalculation per anchor — value area boundaries update to reflect whichever session definition is active, instead of carrying over stale value-area math from a differently-anchored profile.
- High-volume node tagging across sessions — flagging POCs that recur at similar price levels across multiple sessions, distinguishing a genuinely significant repeated equilibrium from a one-off single-session POC.
Getting the anchor right is also the foundation for reading when that equilibrium is actually being tested — which connects to best time of day to trade crypto for volume: a correctly anchored session tells you where the equilibrium sits, and the volume-timing post covers when that equilibrium is most likely to actually be defended or broken.
Execution: How to Read the Indicator on Your Chart
- Confirm the anchor setting matches a UTC daily reset before trusting the POC. If the profile is still running on a default equities session clock, treat the POC as unreliable until the anchor is corrected.
- Check whether you're viewing a rolling or fixed-session profile before comparing levels across days. Comparing a rolling POC to a prior fixed-session POC is comparing two different calculations, not two comparable data points.
- Cross-reference a repeated high-volume node flag before treating a POC as structural. A POC that's flagged as recurring across multiple sessions carries more weight than a single session's POC standing alone.
Frequently Asked Questions
Why does TradingView's default volume profile look wrong on a crypto chart? The default session setting is built for equity markets with a defined open and close, so it applies a session boundary that doesn't correspond to any actual behavioral unit in a 24/7 market. The volume data displayed is accurate; the boundary it's grouped by isn't meaningful for crypto without adjustment.
Should I use a daily or weekly volume profile for crypto? Both have valid uses but answer different questions — a daily UTC-anchored profile is better for reading current, recent equilibrium, while a weekly profile is better for identifying broader structural levels that have held across multiple sessions. Using only one without the other means missing either the immediate context or the larger structure.
Does it matter what time zone I set the session anchor to? It matters for consistency more than for any single "correct" time zone — UTC is the most common convention because it removes daylight-saving shifts and gives every session an identical, comparable length. What matters most is using the same anchor consistently so sessions remain comparable to each other over time.
Ready to Trade With a Session That Actually Means Something?
A POC calculated over the wrong boundary is still a real number — it just isn't describing the equilibrium you think it is.
Ready to implement this institutional logic? Deploy the Session Volume Profile indicator on your charts now.