
Why Your Multi-Timeframe Analysis Keeps Contradicting Itself
Introduction: Two Charts, Two Truths, One Market
You open the 4-hour chart and the structure is clearly bullish — higher highs, higher lows, no signs of exhaustion. You drop down to the 15-minute chart to time an entry, and it shows a fresh bearish Change of Character, lower highs forming, momentum clearly rolling over. Both charts are showing you real, accurately-plotted structure. Neither is malfunctioning. The contradiction you're seeing isn't a flaw in your analysis — it's the fractal nature of price action working exactly as it should, and the problem is that you're treating two structurally different signals as if they were supposed to resolve into one answer.
This post explains why timeframes disagree by design, why that disagreement doesn't mean either reading is wrong, and how to build a hierarchy between them instead of getting stuck alternating between two charts that will never fully agree.
The Core Logic: Why Disagreement Is the Default State, Not the Exception
Market Structure Is Fractal
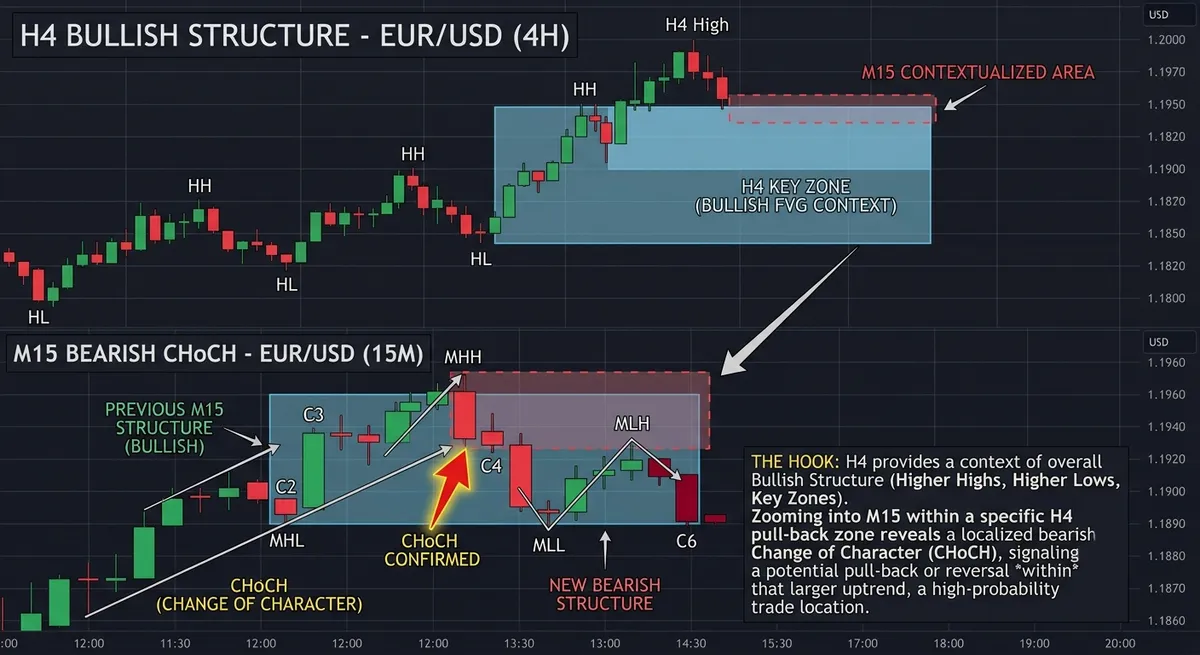
Every timeframe has its own independent, internally consistent structure of swing highs, swing lows, breaks of structure, and changes of character. A bullish structure on the 4-hour chart is built from swing points that, when you zoom into the 15-minute chart, are themselves made up of smaller swings with their own BOS and CHoCH events. This means a bearish CHoCH on a lower timeframe is not automatically evidence against the higher timeframe trend — it's simply the lower timeframe reporting its own local structure, which is a different, smaller-scale measurement than what the higher timeframe is reporting.
Correction vs. Reversal Is a Timeframe-Relative Question
What appears as a full reversal on a lower timeframe is, more often than not, a corrective retracement within the higher timeframe's larger impulse. A 4-hour uptrend doesn't move in a straight line — it advances through a sequence of impulse legs and corrective pullbacks, and every one of those corrective pullbacks will, by definition, produce genuine bearish structure when viewed on a lower timeframe. The lower timeframe isn't lying about what it sees. It's accurately describing a correction that the higher timeframe context would identify as temporary, if you were looking at both together rather than reacting to the lower timeframe in isolation.
Timeframes Are Not Equally Weighted
This is the misconception that causes the most damage: treating every timeframe's signal as if it carries the same authority. In practice, higher timeframes represent a larger sample of participation and more established structure, while lower timeframes are inherently noisier and shift far more frequently. A trading approach that gives a 15-minute CHoCH the same weight as a 4-hour trend is structurally biased toward overreacting to noise. The correct relationship is hierarchical, not equal: higher timeframe structure sets the directional bias, and lower timeframe structure is used only to time entries within that bias — not to override it.
Why Single-Timeframe Reactions Fail
Reacting to any single timeframe's signal in isolation ignores the fact that a full picture requires synthesis across at least two levels: a higher timeframe for directional context and a lower timeframe for execution timing. A trader who only watches one timeframe is either missing the broader trend context (if they only watch the lower timeframe) or missing precise entry timing (if they only watch the higher timeframe). Neither approach is wrong in isolation — they're both incomplete, which is exactly why "which timeframe is right" is the wrong question. The reliable approach checks whether the lower timeframe's signal is occurring within the higher timeframe's established bias, rather than treating either signal as sufficient on its own.
The Practical Cost of Getting This Backward
Traders who let lower-timeframe noise override higher-timeframe bias tend to exit winning positions during normal corrective pullbacks, then re-enter late once the higher-timeframe trend has already resumed — capturing less of the actual move while paying more in transaction costs and whipsaw losses. This is a direct, repeatable consequence of missing hierarchy, not a matter of bad luck on individual trades.
The Bridge: How the Multi-Timeframe Trend Dashboard Resolves the Hierarchy
Manually holding two or three charts in your head at once, correctly weighting which one takes priority, and continuously re-checking whether a lower-timeframe signal is a genuine reversal or just a corrective pullback within higher-timeframe structure is a synthesis task, not a single-glance read — and it has to be repeated every time either chart updates.
Why this specific problem benefits from a rules-based tool rather than manual cross-referencing: the hierarchy itself is not subjective — higher timeframe structure should take priority over lower timeframe noise as a matter of definition, not personal preference — but manually holding multiple timeframes' current structural state in memory while trading live is an attention-limited task that degrades under pressure. This connects directly to the same principle covered in why your order blocks keep failing, where a zone's validity was shown to depend on higher-timeframe alignment — this post extends that same hierarchy logic to trend direction itself, not just individual zones.
The Multi-Timeframe Trend Dashboard applies this hierarchy automatically:
- Simultaneous structure tracking — monitors BOS/CHoCH events across multiple timeframes at once, so you're not manually switching between charts to check each one's current state.
- Bias-priority weighting — surfaces the higher-timeframe directional bias as the dominant signal, and flags lower-timeframe structure shifts as either "within bias" (a likely correction) or "against bias" (requiring more scrutiny).
- Contradiction alerts — explicitly flags when timeframes disagree, rather than presenting a single blended signal that hides the disagreement you actually need to be aware of.
- Timing layer separation — keeps the higher-timeframe bias and lower-timeframe entry signal visually distinct, reinforcing that one sets direction and the other sets timing, rather than treating them as competing votes.
Execution: How to Read the Indicator on Your Chart
- Check the higher-timeframe bias flag before reacting to any lower-timeframe signal. If the dashboard shows the higher timeframe still bullish, treat a lower-timeframe bearish CHoCH as a probable correction to watch, not a reversal to act on immediately.
- Use the "within bias" vs. "against bias" tag to decide how much scrutiny a lower-timeframe signal deserves. A signal flagged as within the higher-timeframe bias needs less confirmation before acting on it for entry timing than one flagged as running against it.
- Treat a contradiction alert as a cue to wait, not to pick a side. When the dashboard explicitly flags disagreement between timeframes, that's information that conditions are transitional — reducing size or waiting for the lower timeframe to resolve is generally more consistent with the hierarchy than forcing a read either way.
Frequently Asked Questions
Why do my timeframes always seem to disagree with each other?
Because market structure is fractal — every timeframe has its own independent swing highs, lows, and structural breaks, and a lower timeframe correction will always produce genuine bearish (or bullish) structure even when the higher timeframe trend is fully intact. The disagreement is expected, not a sign that one chart is wrong.
Which timeframe should I trust more when they conflict?
The higher timeframe should generally set your directional bias, since it reflects more established structure and a larger sample of participation, while the lower timeframe is best used for timing entries within that bias rather than overriding it. Giving both equal weight tends to cause overreacting to lower-timeframe noise.
How many timeframes should I actually check before trading?
Two is typically sufficient for most approaches — one higher timeframe for directional bias and one lower timeframe for entry timing. Adding more timeframes increases the chance of conflicting signals without necessarily improving decision quality, since the core need is a clear hierarchy, not additional data points.
Ready to Stop Choosing Between Charts?
Your timeframes aren't contradicting each other by accident — they're reporting different, equally valid layers of the same structure, and the fix is a hierarchy between them, not picking the one that agrees with what you already want to do.
Ready to implement this institutional logic? Deploy the Multi-Timeframe Trend Dashboard on your charts now.