
How to Tell a Real Liquidity Grab From a Genuine Breakout
Introduction: The First Five Seconds Look Identical
A level breaks. Price pushes through a prior high or low with conviction. In the moment, a genuine breakout and a liquidity sweep look exactly the same — that's precisely why so many traders enter on the break itself and get caught on the wrong side.
The difference isn't visible at the moment of the break. It's visible in what happens in the seconds and candles immediately after it — and most traders never wait long enough to see it, because waiting feels like missing the move. This post lays out the specific, checkable criteria that separate the two, and how to apply them systematically instead of guessing under pressure.
The Core Logic: A Diagnostic Framework, Not a Gut Call
Distinguishing a sweep from a breakout isn't about intuition — it's about checking a specific set of conditions in sequence. None of these are conclusive alone; together, they form a reliable read.
1. Wick-to-Body Ratio at the Break
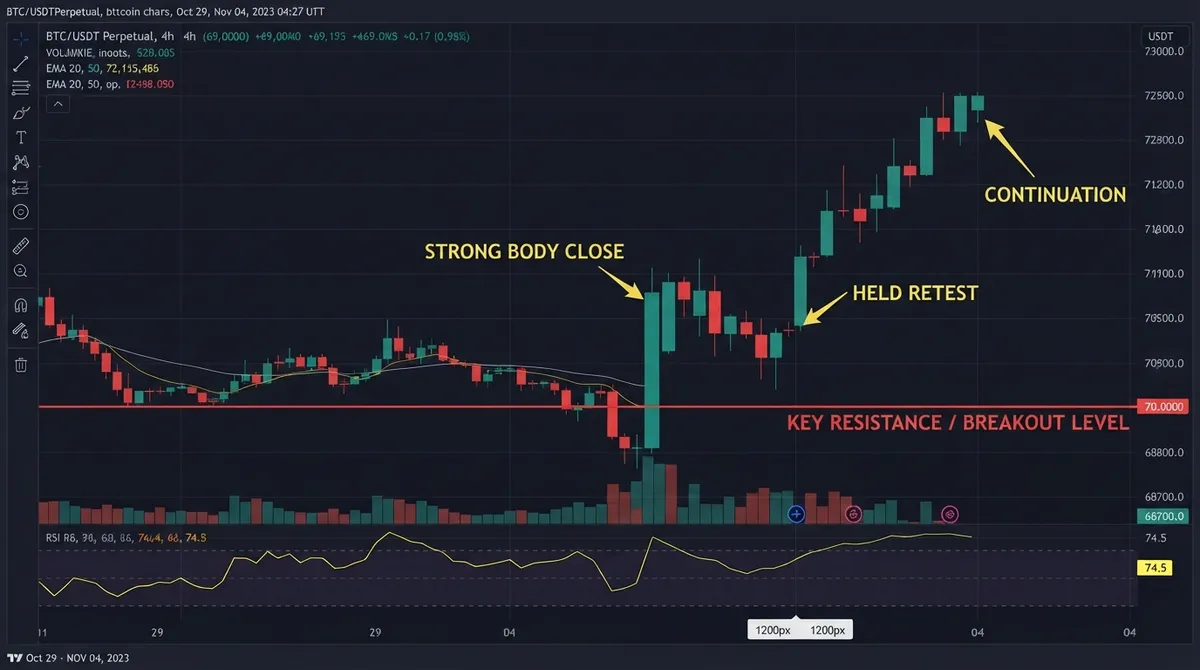
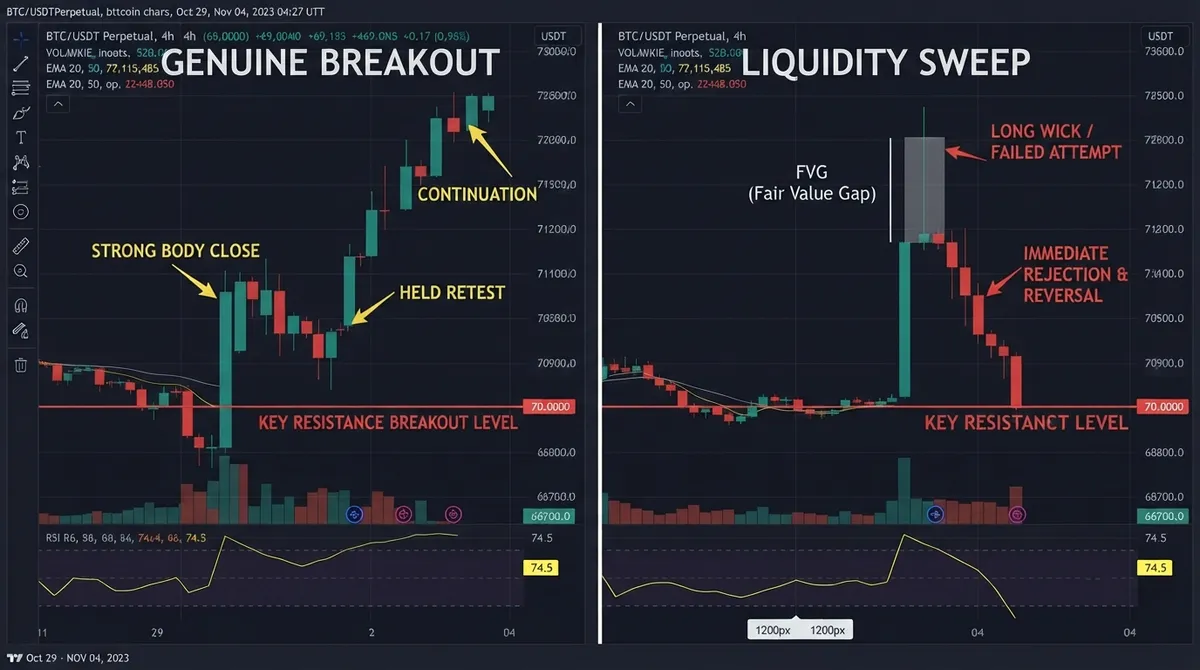
A genuine breakout typically closes with a strong body beyond the level — the market accepted the new price. A liquidity sweep produces a long wick beyond the level with a body that closes back inside the prior range — the market rejected the extreme almost immediately. This is the fastest first check, and often the most telling.
2. Retest Behavior
This is the highest-confidence signal, but it requires patience. A genuine breakout, on retesting the broken level, tends to hold — the old resistance becomes new support (or vice versa). A liquidity sweep, on any retest, tends to fail immediately and continue in the original direction, because the level was never genuinely accepted as fair value in the first place.
3. Follow-Through Displacement
A real breakout is typically followed by continued, expanding movement in the breakout direction over the next several candles. A sweep is typically followed by displacement in the opposite direction — sharp, fast movement back through the level, often leaving its own Fair Value Gap behind as evidence of urgency.
4. Time and Session Context
Liquidity grabs cluster disproportionately around session opens, major news releases, and low-liquidity windows — moments when a relatively small order can move price disproportionately and trigger a dense cluster of resting stops. A break occurring during these windows deserves more scrutiny than one occurring during sustained, orderly trend conditions.
5. Higher-Timeframe Agreement
A breakout that aligns with the higher-timeframe trend has structural support behind it. A break that runs directly counter to the higher-timeframe bias is statistically more likely to be a liquidity event — the market taking out an obvious level before continuing the dominant direction — than the start of a genuine reversal.
Why No Single Signal Is Enough
Each of these checks can individually produce false reads — a strong body close can still fail on retest; a countertrend break can occasionally be genuine. The reliability comes from stacking multiple conditions in the same direction. A break with a strong body close, a held retest, continued displacement, and higher-timeframe agreement is a high-confidence breakout. A break with a long rejecting wick, an immediate failed retest, and reversal displacement is a high-confidence sweep. Most real-world cases fall somewhere between, which is exactly why checking all five conditions — rather than reacting to the first one — is what separates a systematic read from a guess.
The Bridge: How the Liquidity Grab Engine Runs This Checklist in Real Time
The framework above is reliable, but running all five checks manually, on a live candle, across every asset you're watching, isn't something most traders can do consistently under time pressure — particularly the retest and follow-through checks, which require waiting through multiple candles without knowing in advance which way it's going to resolve.
Why this concept specifically benefits from automation: unlike a single-indicator signal, distinguishing a sweep from a breakout requires synthesizing several independent conditions (wick ratio, retest outcome, follow-through, HTF context) into one read — exactly the kind of multi-factor scoring a rules-based tool can apply consistently, without the impatience that causes traders to jump in before the picture is confirmed.
The Liquidity Grab Engine applies this same diagnostic logic automatically:
- Break classification — evaluates wick-to-body ratio and immediate rejection speed the instant a marked level breaks, and tags the event as a probable sweep or a probable breakout.
- Retest tracking — continues monitoring the level after the initial break and updates its classification if the retest confirms or invalidates the original read.
- HTF context overlay — cross-references the break against higher-timeframe bias, flagging countertrend breaks for extra scrutiny rather than treating every break as equal-weight.
This doesn't remove the need for the retest — it removes the need for you to sit and manually track it across every asset while also managing everything else on your screen.
For the mechanics of why liquidity gets targeted in the first place, this connects directly to why your stop loss gets hit before the reversal — that post covers the "why," this one covers the "how to confirm it after the fact."
Execution: How to Read the Indicator on Your Chart
- Check the initial break tag before reacting to the break itself. If the engine flags a level break as a probable sweep based on wick-to-body ratio, treat the move with suspicion rather than entering in the direction of the break.
- Wait for the retest update before committing size. A break initially tagged uncertain that gets reclassified as a confirmed breakout after a held retest is a substantially higher-confidence entry than reacting to the first tag alone.
- Weight the HTF context flag heavily on countertrend breaks. A break moving against the higher-timeframe bias should require more confirmation, not less — use this flag to filter out lower-probability countertrend entries before they cost you.
Frequently Asked Questions
What's the fastest way to tell a liquidity grab from a breakout?
The wick-to-body ratio at the moment of the break is the quickest first read — a strong body close beyond the level favors a genuine breakout, while a long wick with a body closing back inside the range favors a sweep. It's not conclusive alone, but it's the fastest available signal.
Should I wait for a retest before entering a breakout?
Generally, yes. The retest is the highest-confidence confirmation available — a level that holds on retest has meaningfully higher odds of being genuine than one judged solely on the initial break. The tradeoff is entering later and at a less favorable price, which is a reasonable cost for the added confirmation.
Can a liquidity grab turn into a real breakout afterward?
Yes — a sweep clears out one side's resting orders, and if the underlying higher-timeframe trend actually supports continuation in the breakout direction after the sweep resolves, price can move genuinely from that point. This is why checking higher-timeframe context matters even after an initial move is classified as a sweep.
Ready to Stop Guessing at the Break?
The difference between a sweep and a breakout is checkable, not intuitive — it just requires tracking more than the first five seconds of the move.
Ready to implement this institutional logic? Deploy the Liquidity Grab Engine on your charts now.