
Why Your Demand Zone Flipped to Resistance and Stopped You Out
Introduction: The Zone Didn't Break — It Switched Sides
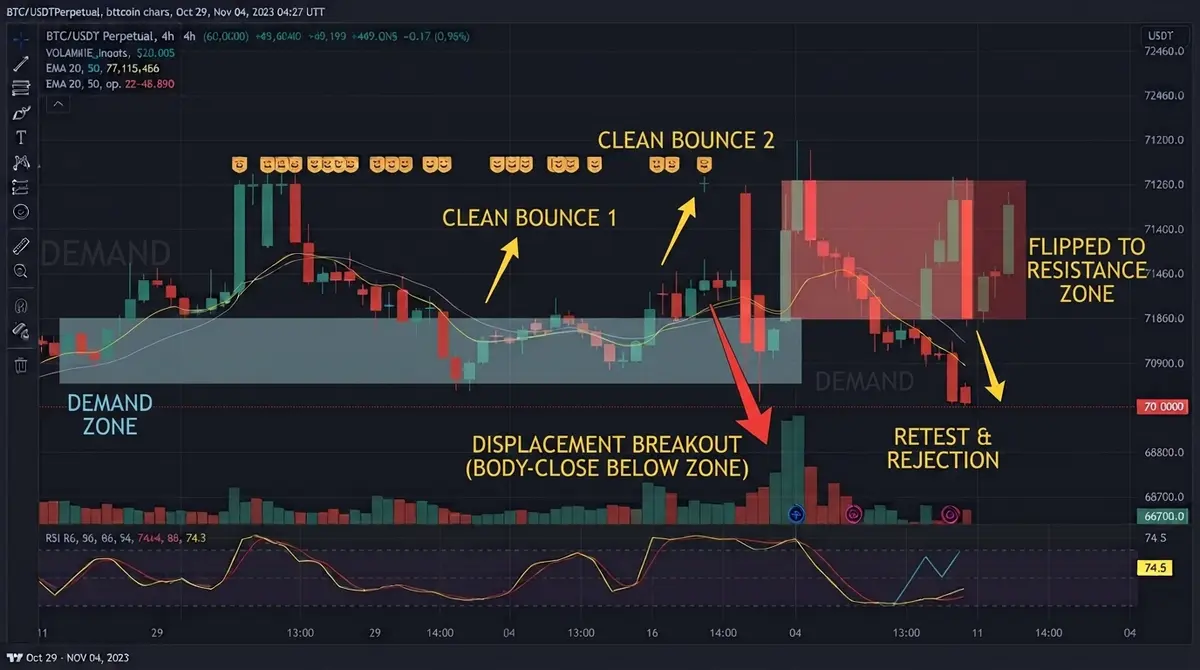
You buy the pullback into a demand zone that held twice before. Same box, same reaction you'd already seen play out. Third touch, price taps in, you enter — and instead of the bounce, price barely pauses before ripping straight through your stop. Worse, on the retest from below a few hours later, that exact same zone now caps every rally attempt. The level that used to be your entry is now the ceiling.
That isn't a demand zone "breaking." Calling it broken treats a structural, mechanical event as random failure — a coin flip that didn't land your way this time. It's a breaker block forming, and it happens the same way every time, with a specific sequence of price action that precedes it. If you know what that sequence looks like, you can see the flip coming instead of discovering it as a stop-out.
The frustrating part is that it doesn't feel random in the moment — it feels personal, like the market waited for your entry specifically. It didn't. The zone flipped because a specific, repeatable sequence of price action completed itself, and that sequence was already visible on the chart before your entry triggered, not after.
This post breaks down exactly what causes a demand zone to invert into supply, the structural conditions that have to be present for a genuine flip versus a temporary wick through the level, and the tell you can check for before you're the liquidity that got taken rather than the trade that got filled.
The Core Logic: What a Flipped Zone Actually Is
Order Blocks Aren't Support and Resistance
Traditional support and resistance is drawn from price memory — a level held before, so traders expect it to hold again. An order block is a different object entirely: it's the last down-close (or up-close) candle before a decisive, displaced move away from it, marking where a large position was likely built. The zone matters because of the imbalance it left behind, not because price "remembers" it.
This distinction matters because support/resistance logic assumes a level either holds or it doesn't — binary, and once broken, irrelevant. Order block logic assumes something more specific: an order block that gets decisively invalidated doesn't become irrelevant, it becomes a breaker block — a zone with an entirely inverted function, now acting in the opposite direction with a mechanical explanation for why.
The Displacement and BOS That Precede a Flip
A demand zone doesn't flip to resistance because price wicked through it once. It flips when price closes through it with displacement — a strong, imbalanced move away from the zone that produces a break of structure (BOS) on the timeframe you're reading. Displacement is the tell: a slow grind through a level is a fake-out candidate; a fast, wide-range candle that closes well beyond the zone and leaves a fair value gap (FVG) behind it is a structural invalidation.
This is the detail that separates "my zone got wicked and held anyway" from "my zone got broken and flipped." A wick without displacement or a confirmed BOS is noise. A close beyond the zone with displacement and a fresh BOS is the market telling you the order flow that defended that level is gone, and the opposite side now controls that price range.
CHoCH: The Signal Retail Traders Read Backwards
A change of character (CHoCH) is the first structural break in the opposite direction of the prevailing trend — the earliest evidence that control has shifted. The mistake most discretionary traders make is treating a CHoCH the same way they'd treat a BOS in an established trend: as continuation confirmation. It isn't. A CHoCH is a warning that the structure defending your zone is compromised, and it typically prints before the zone actually flips, not after.
Reading CHoCH correctly means treating it as an early exit or risk-reduction signal on positions built around the zone, not as noise to ignore until the zone visibly fails. By the time the zone has obviously flipped, the CHoCH that predicted it already printed several candles earlier.
Why the Third Touch Fails: Inducement and Liquidity Engineering
Zones don't usually fail on the first retest. They tend to fail on the second or third — precisely because each successful reaction trains discretionary traders to add size on the next one. That crowding is the setup. The buyside/sellside liquidity (BSL/SSL) resting just above or below the zone, built from stops of traders who entered on the earlier successful touches, is what makes the zone worth sweeping.
This is inducement (also called IDM — inducement) at work: price creates a pattern of reliable reactions specifically to draw in orders and stops at a predictable location, then uses that liquidity to fund the real, displaced move through the zone. The third touch isn't unlucky. It's the point at which enough stop liquidity has accumulated behind the zone to make breaking it worthwhile.
Framed in internal range liquidity (IRL) versus external range liquidity (ERL) terms: the first two reactions off the zone build up internal liquidity within the existing range — stops from longs entering on the bounce, sitting just below the zone. Once that internal pool is large enough, it becomes a more efficient target than whatever external liquidity sits beyond the range extremes. The market takes the path of least resistance to the nearest meaningful pool of stops, and after two clean reactions, that pool is sitting directly beneath the zone you're buying.
Why One Flipped Zone Isn't a Signal on Its Own
Even a textbook breaker block — clean displacement, confirmed BOS, liquidity swept beforehand — isn't a standalone trade signal. A single structural event on one timeframe can conflict with a higher-timeframe bias, land inside an already-mitigated range, or form without a corresponding imbalance to support continuation. A breaker forming on a 15-minute chart while the 4-hour range is still firmly bullish, for example, is a materially weaker signal than the same breaker forming in alignment with a higher-timeframe change of character that already printed.
Institutional desks don't trade a breaker block in isolation; they trade it as one confirming input alongside higher-timeframe range context, unmitigated imbalance nearby, and the location of that breaker relative to the broader IRL/ERL map. Treating any single flip as sufficient on its own is the same discretionary trap as treating the original zone as permanent support — it swaps one oversimplification for another.
The Bridge: How Automated Order Blocks Solves This
Spotting a genuine breaker block manually means tracking, in real time, whether a close beyond a zone had displacement, whether it produced a confirmed BOS or just a CHoCH, and whether meaningful liquidity was resting behind the level before the break — three separate judgment calls, on every zone, on every timeframe you're watching. That's exactly the kind of pattern-recognition-under-pressure that degrades the moment a trade is open and emotion enters the read.
Automated Order Blocks removes the judgment calls by tagging zone state directly on the chart. It maps to this problem through:
- Live zone status labeling — every order block is tagged fresh, mitigated, or broken, so a zone that's already been invalidated never gets mistaken for tradeable support.
- Displacement-confirmed break detection — the indicator only reclassifies a zone as a breaker after a close beyond it accompanies genuine displacement, filtering out wicks that would fool a discretionary read.
- BOS/CHoCH flagging on the structure that formed the zone — so you can see whether the invalidation came with a confirmed break of structure or only an early change-of-character warning.
- Multi-timeframe context overlay — flagging whether a lower-timeframe breaker aligns with or fights the higher-timeframe range, which is the same confluence check that keeps a single flipped zone from being over-trusted in isolation.
This connects directly to a broader pattern worth understanding on its own: if zones you're marking manually keep failing even when they look textbook, the underlying issue is usually the same tagging problem covered in why your order blocks keep failing — stale or unmitigated zones getting traded as if they were fresh.
Execution: How to Read the Indicator on Your Chart
- Check the zone's status tag before entering. A zone marked "mitigated" or "broken" is not a demand zone anymore regardless of how it looks visually — don't take a long into a zone the indicator has already reclassified.
- Confirm a labeled displacement + BOS candle before treating a flip as real. If the break beyond your zone isn't flagged with both displacement and a confirmed BOS, treat it as a wick, not a structural invalidation, and don't yet trade the breaker in the opposite direction.
- Check the higher-timeframe overlay before trading a lower-timeframe breaker retest. A breaker that aligns with the higher-timeframe range has materially different odds than one forming against it — don't size the same way into both.
Frequently Asked Questions
What's the difference between a breaker block and a regular order block? An order block is the origin candle of a displaced move that hasn't been invalidated — it's still functioning in its original direction. A breaker block is that same structural object after price has closed back through it with displacement, flipping its function to the opposite side. Same object, different state.
Why did my support zone become resistance specifically on a crypto pair? The mechanism itself — displacement, BOS, liquidity sweep, flip — isn't crypto-specific; it happens on any liquid, order-flow-driven market. Crypto tends to make the pattern more visible because thinner liquidity and higher volatility produce sharper displacement candles and faster liquidity sweeps than in slower markets.
How many times can a zone flip before it stops being valid? There's no fixed count — a zone remains valid as a breaker until price displaces back through it again with a confirmed structural break, at which point it either flips back or becomes irrelevant range noise. In practice, zones that have already flipped once tend to see fewer clean reactions each additional time, since the liquidity that made each flip worthwhile gets progressively used up.
Ready to Stop Getting Flipped On?
The zone that stopped you out wasn't broken by chance — it was invalidated by a specific, checkable sequence you can start reading before the fact instead of after.
Ready to implement this institutional logic? Deploy the Automated Order Blocks indicator on your charts now.