
The Fee Math That Quietly Kills Most Crypto Scalpers
Introduction: A Winning Strategy That Still Loses Money
You've tracked your scalps for a few hundred trades. Win rate sits comfortably above fifty percent. By the count that most traders use to judge a strategy, this should be working — and yet the account balance tells a different story, drifting down slowly rather than up, trade after mechanically correct trade.
This isn't a strategy problem in the way it looks. The setups are firing correctly, the win rate is genuinely favorable, and the account is still losing, because win rate alone was never the number that determines profitability. What determines profitability is win rate measured against the actual break-even win rate required once fees are subtracted from every single trade — and on a scalping timeframe, that required number is a lot higher than most traders ever bother to calculate.
The reason this specific failure mode is so easy to miss is that it doesn't show up as a string of losing trades you can point to. Individual trades look fine. The strategy "works" on any single trade you examine. The erosion happens across the aggregate, one small fee at a time, on both winners and losers alike, which makes it almost invisible unless you're specifically tracking net numbers against a calculated break-even threshold rather than just watching the win rate climb.
This post covers the specific mechanics of how trading fees erode a scalping edge more aggressively than any other style, walks through an illustrative version of the break-even math so the mechanism is concrete rather than abstract, and explains what to check before trusting a win rate that looks good on paper.
The Core Logic: Where Win Rate Stops Being the Right Number
Why Win Rate Alone Doesn't Determine Profitability
A win rate by itself says nothing about profitability without being paired with the size of wins relative to losses, and without accounting for the cost of executing every trade. A strategy with a 60% win rate and a 1:2 risk-to-reward ratio in the trader's favor is comfortably profitable before fees. The same 60% win rate with a 1:1 ratio, once realistic round-trip fees are subtracted from every trade, can be a net loser — same win rate, completely different outcome, because win rate was never sufficient on its own.
The Break-Even Win Rate Formula: Where Fees Actually Enter the Math
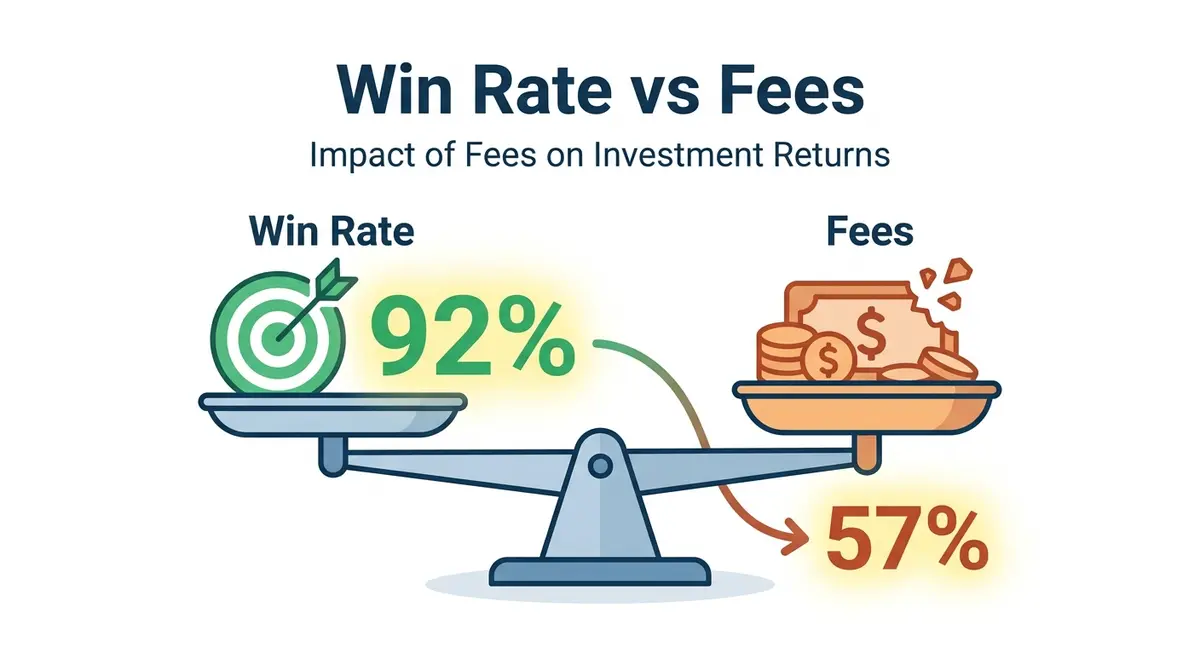
The break-even win rate is the minimum win rate required for a strategy to net zero given its average win size, average loss size, and the transaction cost paid on every round trip regardless of outcome. Fees don't just eat into profit on winning trades — they're paid on every single trade, wins and losses alike, which means they function as a fixed tax on trade frequency rather than a cost that only shows up occasionally. As an illustrative example: a scalper targeting a small, tight move with a roughly 1:1 risk-to-reward ratio might calculate a naive break-even win rate near 50% looking only at price movement. Once realistic round-trip fees are added into that same calculation, because the fee cost is large relative to the small target being scalped, the actual required win rate to break even can climb dramatically — in an illustrative case, from a naive-looking figure into the low-to-mid 90% range once taker fees on both legs of every trade are properly accounted for. These specific figures depend entirely on the fee tier, position size, and target used in the calculation; the point is the direction and magnitude of the shift, not a fixed number that applies universally.
Maker vs Taker Fees and Why Order Type Changes the Number
Exchanges typically charge a materially higher fee for taker orders — orders that execute immediately against existing liquidity — than for maker orders, which add liquidity by resting on the book until filled. A scalper using market orders or aggressive limit orders that fill immediately is paying the taker rate on every entry and every exit, twice per trade. The same strategy executed with resting limit orders that qualify for the maker rate, combined with a higher-volume fee tier that most exchanges offer as trading volume increases, can bring that same illustrative break-even win rate down substantially — in the same illustrative scenario, from the low-90s back down to somewhere near the high-50s. That's not a small adjustment; it can be the difference between a strategy that's structurally unprofitable and one that has genuine room to work, without changing the underlying setups being traded at all.
Why Scalping Amplifies Fee Drag More Than Any Other Style
The mechanism that makes fees especially damaging to scalping specifically is trade frequency combined with small per-trade targets. A swing trader paying the same round-trip fee percentage barely notices it, because the fee is small relative to a target that might be five or ten times larger. A scalper targeting a fraction of a percent per trade is paying that same fee against a much smaller base, which means the fee consumes a proportionally larger share of the edge on every single trade. Run enough trades, and a fee that looks trivial in isolation compounds into the dominant factor separating a profitable system from an unprofitable one.
Frequency compounds this in a second, less obvious way. A swing trader might pay the round-trip fee a handful of times a week. A scalper running dozens of trades in a session pays it dozens of times in the same window, which means any miscalculation in the break-even math gets multiplied by trade count far faster on a scalping timeframe than on any slower style. A break-even error that costs a swing trader a rounding error over a month can cost a scalper a meaningful chunk of the account over the same period, purely because of how many times the same fee gets paid.
Why a Backtest Without Fees Baked In Isn't a Backtest
A backtest that reports gross price movement without subtracting realistic round-trip fees isn't measuring the strategy that would actually get traded — it's measuring a version of it that doesn't exist on a live exchange. This matters more for scalping than for any other style precisely because of the frequency effect above: a strategy that looks robustly profitable on gross numbers can flip to a net loser the moment realistic fees are applied, and the smaller the per-trade target, the larger that gap tends to be.
The Bridge: How High-Frequency Scalper Solves This
Manually recalculating the break-even win rate every time fee tiers change, order type shifts, or position sizing adjusts is exactly the kind of ongoing math that gets done once at setup and then quietly goes stale as conditions change — which is how a strategy that was fee-viable at launch can become fee-unviable months later without anyone noticing until the equity curve confirms it.
High-Frequency Scalper is built to keep this calculation live rather than a one-time assumption:
- Fee-aware backtesting — historical performance is calculated with round-trip fees subtracted per trade at the fee tier you specify, rather than reporting gross price movement as if execution were free.
- Break-even win rate display per fee tier — the required win rate to reach net zero is shown directly, so a strategy's actual win rate can be checked against the real bar rather than an assumed 50%.
- Maker/taker execution filtering — flagging which setups are structured for resting, maker-qualifying entries versus which require an immediate taker fill, since that distinction materially changes the fee side of the math.
- Realized net P&L tracking — performance reporting reflects fees actually paid rather than gross price movement, so the number you're watching during live trading is the one that matters.
This connects to a related mechanical issue that compounds the same problem: high trade frequency itself, independent of fees, is covered in why scalping crypto feels impossible on the 1-minute chart — the two issues often show up together, since the same conditions that make the 1-minute chart hard to read discretionarily are the ones that tempt overtrading, which multiplies the fee drag covered here.
Execution: How to Read the Indicator on Your Chart
- Check the displayed break-even win rate for your current fee tier before trusting your live win rate. A win rate that looks good in isolation only matters relative to the actual break-even threshold for your specific fee structure.
- Confirm whether a flagged setup is maker-qualifying or requires a taker fill before entering. The fee difference between the two can materially change whether a given setup clears your break-even threshold at all.
- Review realized net P&L, not gross price-movement P&L, when evaluating recent performance. Gross numbers will consistently overstate performance on a scalping timeframe; net numbers are the ones that reflect what actually happened to the account.
Frequently Asked Questions
What win rate do I actually need to be profitable scalping crypto? There's no fixed universal number — it depends on your risk-to-reward ratio, position size, and specific fee tier, which is why it needs to be calculated rather than assumed. A 1:1 setup on a tight target with high taker fees can require a dramatically higher win rate than the same setup with maker-qualifying limit orders at a lower fee tier.
Does moving to a lower exchange fee tier actually make a meaningful difference? Yes, disproportionately so for scalping specifically, because fees are paid on every trade regardless of outcome and scalping trades far more frequently than other styles. The same percentage fee reduction that a swing trader would barely notice can be the difference between a scalping strategy being structurally viable or not.
Why did my backtest results not match my live trading results? The most common cause on scalping timeframes is a backtest that didn't account for realistic round-trip fees, or assumed maker-rate fills on trades that would actually require a taker fill in live conditions. Reconciling the two usually starts with checking whether fees were properly modeled in the backtest at all.
Ready to Trade Against Real Numbers, Not Gross P&L?
A favorable win rate means nothing if it's still below the break-even threshold your fee structure actually requires.
Ready to implement this institutional logic? Deploy the High-Frequency Scalper indicator on your charts now.