
The Best Crypto Order Block Indicator Only Shows You 3 Zones, Not 30
Introduction: More Boxes Isn't More Edge
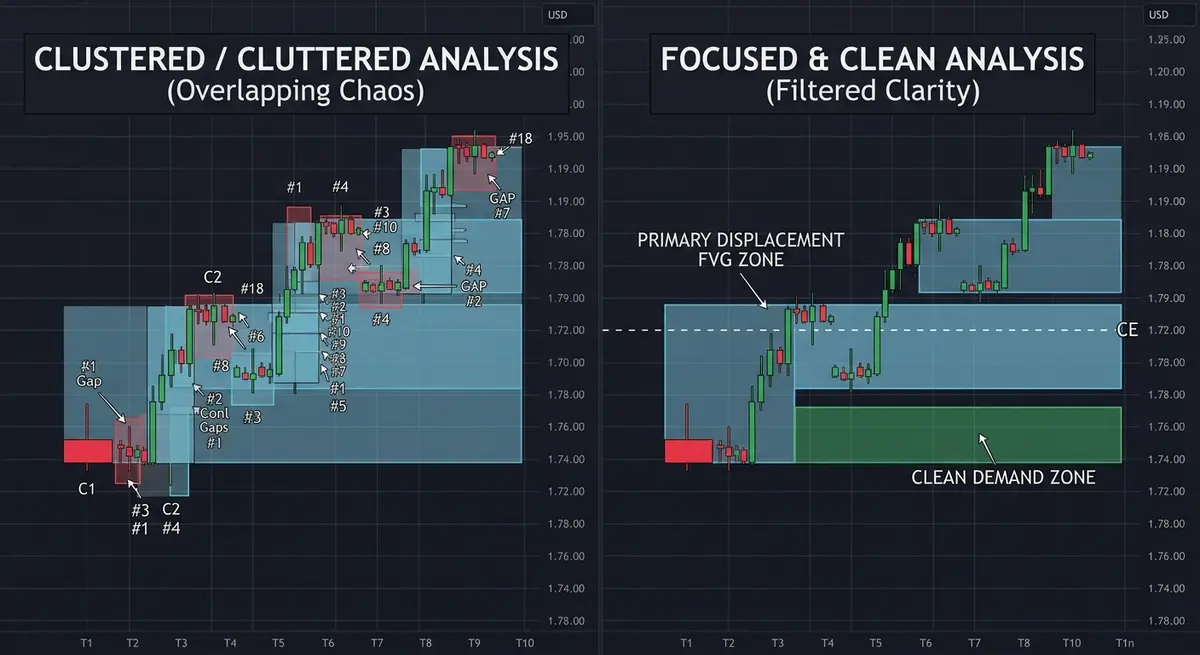
You load an order block indicator, and within seconds your chart is wallpapered — a dozen boxes on the visible range, more stacked off-screen, some overlapping, some nested inside others. Every pullback now touches something. Every breakout has a "zone" behind it. The tool feels thorough. In practice, it's unusable, because a signal that fires on every candle isn't a signal.
The instinct when this happens is to assume you just need a better eye — scroll through, mentally rank the boxes, keep the ones that "feel" significant and ignore the rest. That instinct is the problem restated, not solved. If the tool can't tell you which zones matter, doing that ranking manually just reintroduces the same subjectivity a rules-based indicator was supposed to remove in the first place.
This isn't a bug in the concept of order blocks — it's a filtering failure. Raw order block detection, run without any pruning logic, will flag every down-close candle before an up-move and every up-close candle before a down-move, regardless of whether that move was significant, whether the zone has already been used up, or whether it's even relevant on the timeframe you're trading. The result is mechanically correct and practically worthless.
This post covers why unfiltered order block detection produces zone overload, the specific pruning logic that separates a genuinely useful order block tool from a box-counting exercise, and what a chart with the right filtering actually looks like compared to one without it.
The Core Logic: Why Raw Detection Produces Clutter
What an Order Block Actually Marks
An order block is the last opposing candle before a displaced move — the origin point of an imbalance, marking where a large position was likely accumulated before price moved away with force. That's a precise, narrow definition. It does not mean "any candle before price went up" or "any candle before price went down." Most naive detection scripts don't check for displacement at all — they just look at the candle immediately preceding a directional move of any size, which is why they flag dramatically more zones than a discretionary SMC trader would ever draw by hand.
Mitigation: Why Most Marked Zones Are Already Dead
An order block's job is done the moment price returns to it and gets a reaction, or trades through it entirely. Once mitigated, redrawing that box and leaving it live on the chart is actively misleading — it implies a level still has unfilled institutional interest behind it when the imbalance has already been addressed. A large share of the "thirty zones" problem is simply zones that were never removed after doing their job. An indicator that doesn't aggressively prune mitigated zones will always look more crowded than the market actually is.
This compounds over time in a specific way: on a chart that's been running for weeks, the number of historically valid order blocks that formed is genuinely large, even if only a handful are currently live. A script that draws every one it ever detected, without removing the ones price has already revisited, isn't wrong about history — it's just presenting stale history as if it were current opportunity. The visual clutter isn't a sign of a noisy market; it's a sign of a tool that never cleans up after itself.
Internal vs External Order Blocks: Not All Zones Carry Equal Weight
Order blocks that form inside an already-established range (internal) carry less structural significance than ones that formed at the origin of the move that created the range in the first place (external, often tied to the BOS that defined the range). Treating every internal order block with the same weight as the external one that set the range is how a chart ends up with a dozen "equally important" zones that aren't equally important at all — most of them are minor internal noise sitting inside a range whose real structure is defined by one or two external zones.
A useful mental model is a nested hierarchy rather than a flat list: the external order block sets the boundary of the current range and represents the highest-conviction zone within it, while internal order blocks are smaller reactions that occur as price oscillates inside that boundary before the next expansion. A discretionary trader scanning quickly tends to weight all of these visually the same, because a box is a box regardless of which category produced it — which is exactly how a chart with one meaningful zone and eight minor ones ends up looking like nine equally valid setups.
Displacement Magnitude Is a Threshold, Not a Binary
Displacement isn't just present or absent — it exists on a spectrum, and small, marginal displaced moves produce order blocks with far less institutional significance than large, clean displacement that leaves a wide fair value gap (FVG) behind it. Detection logic that treats a candle with a hint of range expansion the same as one that produced a genuine imbalance will flag the same volume of "zones" regardless of quality, which is precisely how low-conviction boxes end up cluttering a chart next to high-conviction ones with no visual distinction between them.
This matters in practice because the two types of zones behave differently on retest. A zone with strong displacement and a wide unfilled FVG behind it tends to produce a sharper, faster reaction when price returns to it, because there's a larger volume of unaddressed imbalance for the market to react to. A zone that barely qualifies as displaced — a marginally larger candle in an otherwise choppy sequence — tends to produce a weaker, slower reaction, or none at all. An indicator that draws both with identical box styling is discarding information it already has access to.
Why Trading Every Zone Guarantees Confluence With Nothing
The entire value of an order block as a concept comes from its rarity and its alignment with higher-timeframe structure — it's supposed to be a specific, high-probability location, not a general-purpose support/resistance grid. If every pullback on the chart touches a zone, then "price reacted at an order block" stops being informative, because it would have been true regardless of where price went. A signal that can't fail to trigger provides zero discriminating information, no matter how technically accurate the underlying detection is.
This is the same statistical problem as a medical test with no false negatives and no specificity — it always says "positive," so a positive result tells you nothing. A chart where every zone qualifies as a reaction point has the same issue: the presence of a box next to a bounce doesn't confirm the order block concept, because a box was always going to be there regardless of the outcome. Genuine confluence requires the zone to be one of a small number of candidates, not one of dozens.
The Bridge: How Automated Order Blocks Filters This
Manually pruning a raw order block chart down to the handful that actually matter means checking mitigation status, comparing internal versus external classification, and judging displacement magnitude on every candidate zone — a filtering workload that most discretionary traders skip, which is exactly why manually-drawn charts tend to either drastically under-mark zones or, more often, over-mark them the same way an unfiltered script does.
This is a case where the discretionary and the algorithmic approach to the same concept can produce genuinely different charts, not just different opinions about the same chart. A prop-desk process applies the same filtering criteria to every zone, every time, regardless of how the last trade went. A discretionary read tends to drift — zones that "worked" recently get remembered more favorably than zones that didn't, which quietly biases which boxes get mentally kept and which get ignored, independent of whether either one actually meets the underlying criteria.
Automated Order Blocks builds that filtering directly into the detection logic rather than leaving it to a manual second pass:
- Automatic mitigation removal — a zone is dropped from the chart the moment it's been tested and used, so every box still visible represents genuinely unaddressed imbalance, not historical clutter.
- Internal/external classification — zones are tagged by their structural role relative to the current range, so a minor internal pullback zone doesn't visually compete for attention with the external zone that actually defines the range.
- Displacement-magnitude filtering — marginal displacement below a meaningful threshold doesn't generate a zone at all, which removes the low-conviction boxes that make raw detection noisy.
- Timeframe-relevance weighting — a zone's prominence on the chart reflects whether it's relevant on the timeframe you're actually trading, rather than surfacing every lower-timeframe micro-zone at the same visual weight as a higher-timeframe one.
That same filtering discipline is what determines whether a zone that does survive the cut is trustworthy when it inverts — which is the exact mechanism covered in why your demand zone flipped to resistance: a flip only means something if the zone that flipped was a real one to begin with.
Execution: How to Read the Indicator on Your Chart
- Check that a zone is still live before reacting to it. If the indicator has already marked a zone as mitigated, don't treat a wick back into it as a fresh entry signal — that imbalance has already been addressed.
- Weight external zones above internal ones when they conflict. If an internal pullback zone and the range-defining external zone point to different reactions, default to the external zone's read of structure.
- Confirm the zone cleared the displacement threshold before sizing up. A zone flagged with strong, clean displacement behind it warrants materially more conviction than a marginal one — don't size both the same.
Frequently Asked Questions
Why do different order block indicators show wildly different numbers of zones on the same chart? The underlying price action is identical, but each tool applies different filtering rules for mitigation, displacement magnitude, and internal versus external classification. An indicator with no filtering will mark every qualifying candle; one with strict pruning logic will show only the handful that meet a higher bar.
Should I just manually delete zones that look unimportant? You can, but manual pruning reintroduces the same subjective judgment that causes over-marking in the first place — what "looks unimportant" tends to shift with recent trade outcomes. A tool that prunes on fixed, consistent criteria removes that inconsistency.
Does fewer zones mean the indicator is missing valid setups? Not if the filtering is criteria-based rather than arbitrary. A tool that removes mitigated, low-displacement, or structurally minor zones isn't missing setups — it's declining to present zones that never met the bar for a genuine order block in the first place.
Ready to Trade Fewer, Better Zones?
A chart that shows you everything is functionally the same as a chart that shows you nothing, because neither one tells you where to look first.
Ready to implement this institutional logic? Deploy the Automated Order Blocks indicator on your charts now.